

(BIVN) – There were 38 newly reported cases of COVID-19 in the State of Hawaiʻi on Tuesday, down from the 69 cases reported on Monday. There were 13 new cases identified on Hawaiʻi island, one more than the 12 identified the day before.
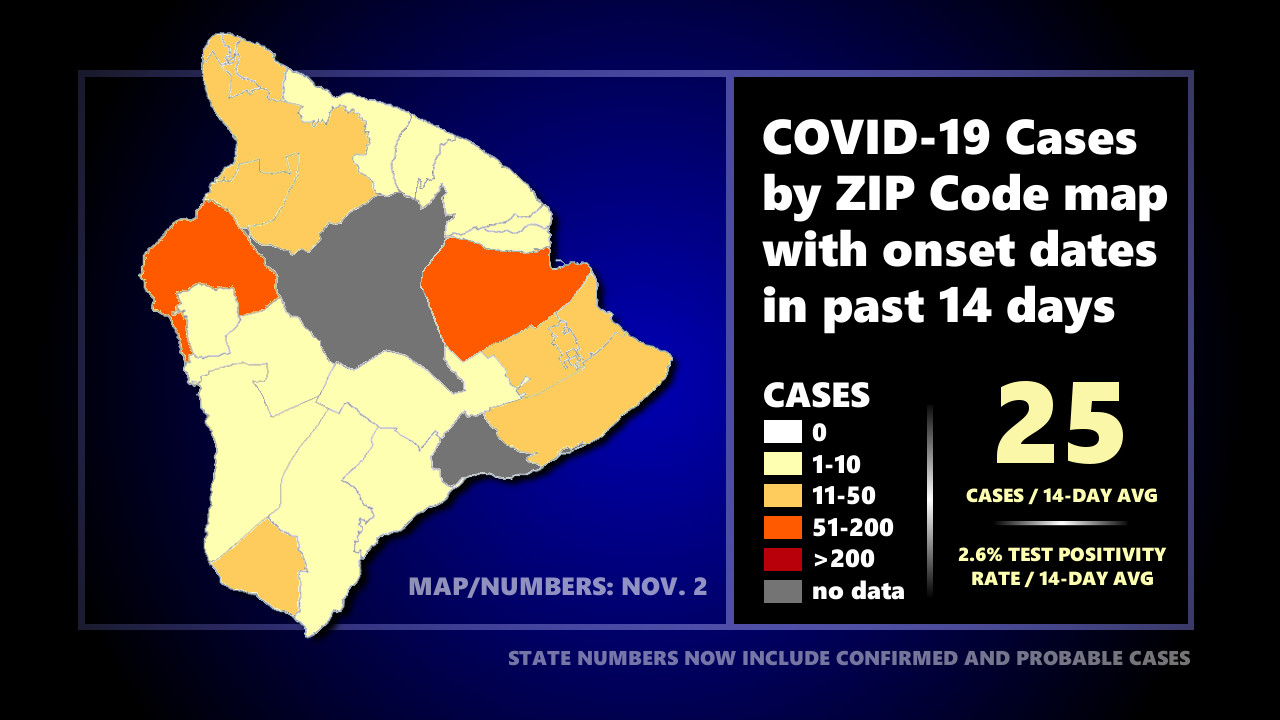
Health officials are currently monitoring 393 active cases on Hawaiʻi island. The test positivity rate in Hawaiʻi County over the last 14 days is 2.6%, one of the lowest reported numbers in weeks. There has been a 14-day average of 25 new cases per day on the Big Island.
On the Health Department’s zip code area map showing reported COVID-19 cases with onset dates in the past 14 days, there are eleven (11) zip code areas on the Big Island showing over 10 cases. Two (2) of those zip code areas are showing over 50 cases. Zip code areas not listed below have recorded less than 10 cases in 14 days.
- 96720 (Hilo) – 112 cases
- 96740 (Kona) – 55 cases
- 96743 (Kohala) – 15 cases
- 96738 (South Kohala) – 11 cases
- 96719 (Hawi) – 22 cases
- 96755 (Kapaʻau) – 18 cases
- 96749 (Puna) – 24 cases
- 96760 (Puna) – 15 cases
- 96771 (Puna mauka) – 23 cases
- 96778 (Puna makai) – 31 cases
- 96737 (Kaʻū, Ocean View) – 14 cases
To date, the State of Hawaiʻi says 2,201,580 cumulative doses of COVID-19 vaccine have been administered. Health officials say 71.4% percent of the State population has been fully vaccinated. 81.3% of the population has initiated vaccination. On Hawaiʻi island, 67% has completed vaccination.
