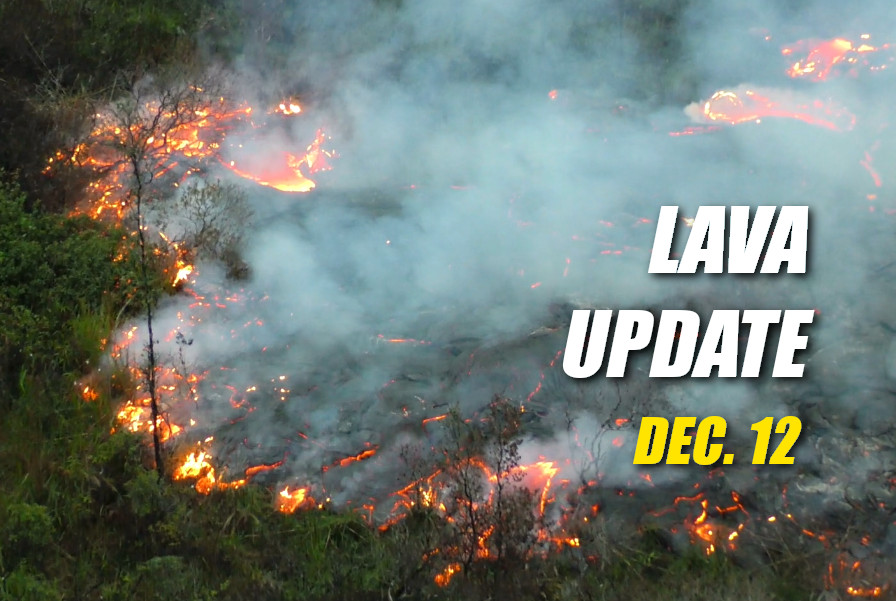
(ABOVE VIDEO) This morning’s Civil Defense message with Friday overflight video courtesy the County of Hawaii.
NEWS BRIEFS
- Tonight, USGS Hawaiian Volcano Observatory scientists say the active tip of the flow was about 1.6 miles from the upslope edge of Pahoa Marketplace along the path of steepest descent that the flow is currently following.
PRIMARY SOURCES

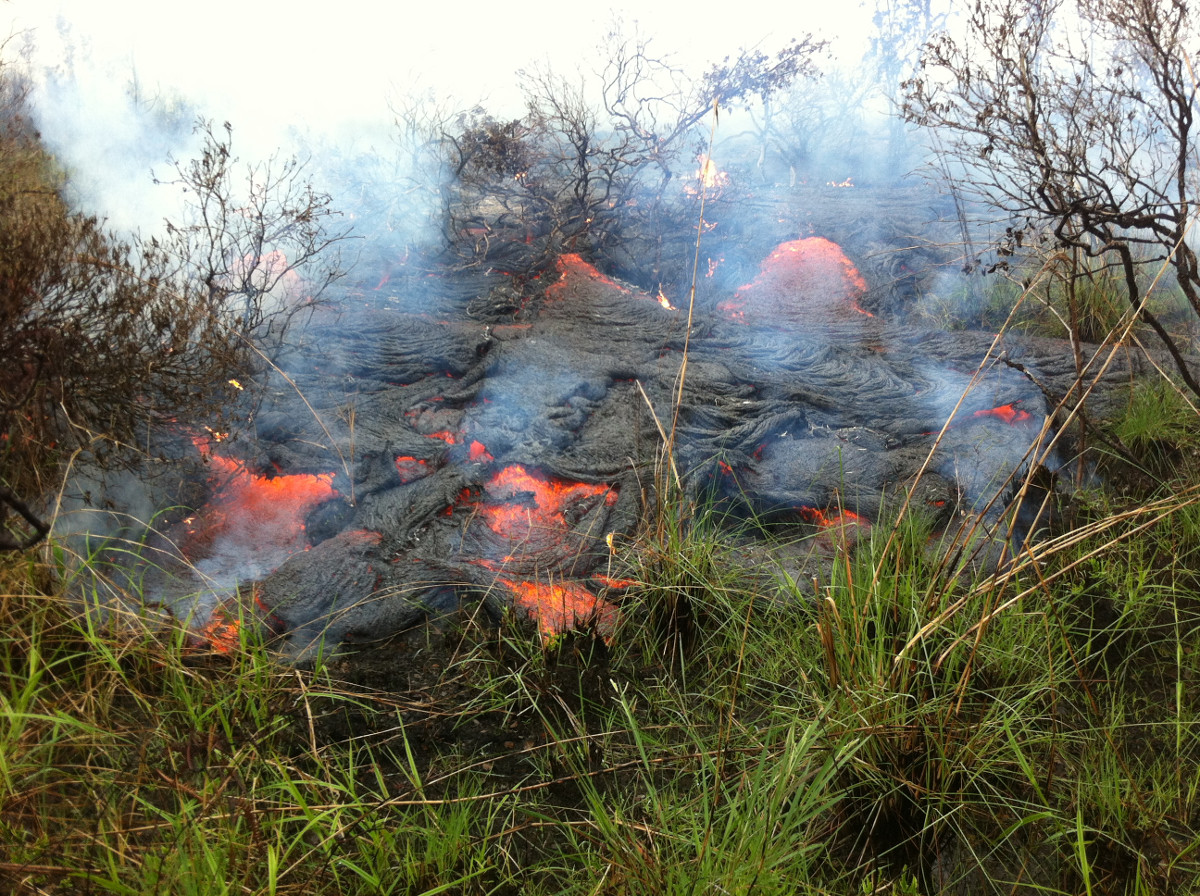
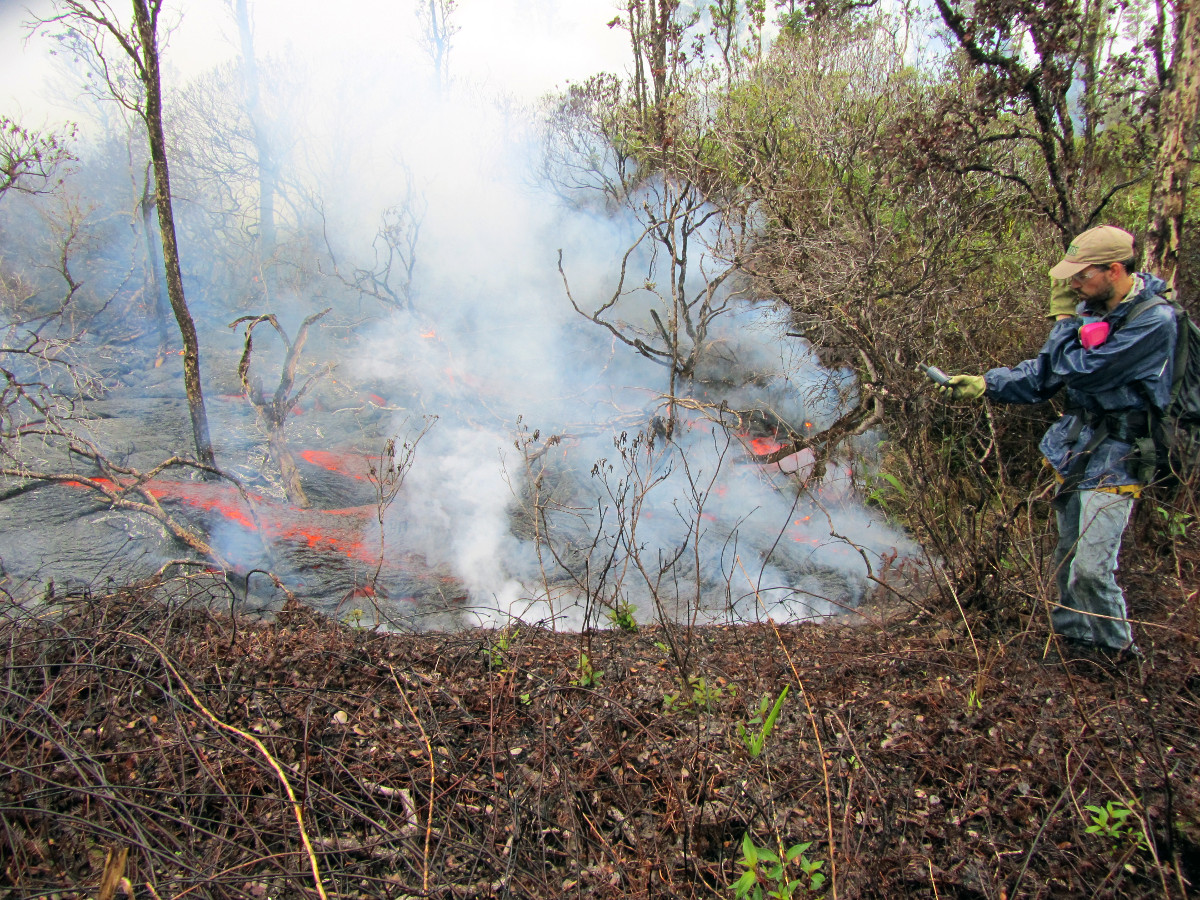
USGS Hawaiian Volcano Observatory (HVO) scientists conducted field mapping around the leading tip of active lava on the June 27th lava flow. The active lobe has advanced about 900 meters (0.6 miles) since the afternoon of December 9, which is equivalent to an average advance rate of approximately 320 meters per day (0.2 miles per day).
The leading edge of this lobe was 2.7 km (1.7 miles) upslope from the intersection of Highway 130 and Pāhoa Village Road at the Pahoa Marketplace, as measured along a straight line. The active lobe is following a steepest-descent path that takes the flow towards the intersection of Pāhoa Village Road and Highway 130, in the vicinity of the Pahoa Marketplace. The leading edge of the lobe was 2.6 km (1.6 miles) upslope from the edge of Pahoa Marketplace, as measured along this path of steepest-descent.USGS Hawaiian Volcano Observatory on Dec.12 at 7:35 p.m. HST
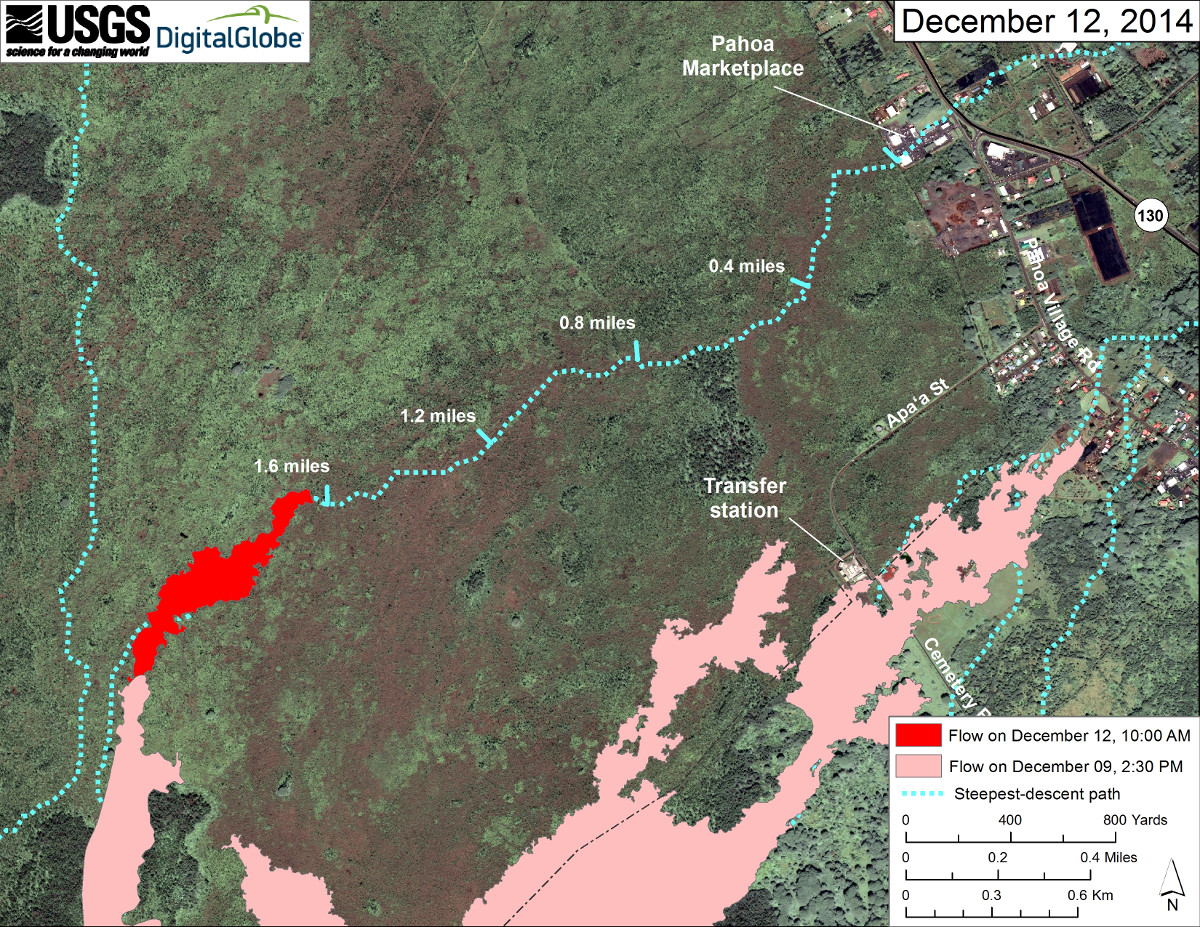
This map uses a satellite image acquired in March 2014 (provided by Digital Globe) as a base to show the area around the front of Kīlauea’s active East Rift Zone lava flow. The area of the flow on December 9, 2014, at 2:30 PM is shown in pink, while advancement of the flow as mapped on the ground on December 12 at 10:00 AM is shown in red. This represents an advancement of 0.9 km (~0.6 miles) in slightly less than 3 days.
The active tip of the flow was about 2.6 km (~1.6 miles) from the upslope edge of the Pahoa Marketplace along the path of steepest descent that the flow is currently following. Tick marks have been placed along the steepest-descent path at an interval of 0.4 miles, measured from Pahoa Marketplace. The front of the flow was at 19.493432, -154.978043 (Decimal Degrees) at an elevation of about 250 meters (~820 ft).
The blue lines show steepest-descent paths calculated from a 1983 digital elevation model (DEM; for calculation details, see http://pubs.usgs.gov/of/2007/1264/). Steepest-descent path analysis is based on the assumption that the DEM perfectly represents the earth’s surface. DEMs, however, are not perfect, so the blue lines on this map can be used to infer only approximate flow paths.USGS Hawaiian Volcano Observatory on Dec. 12