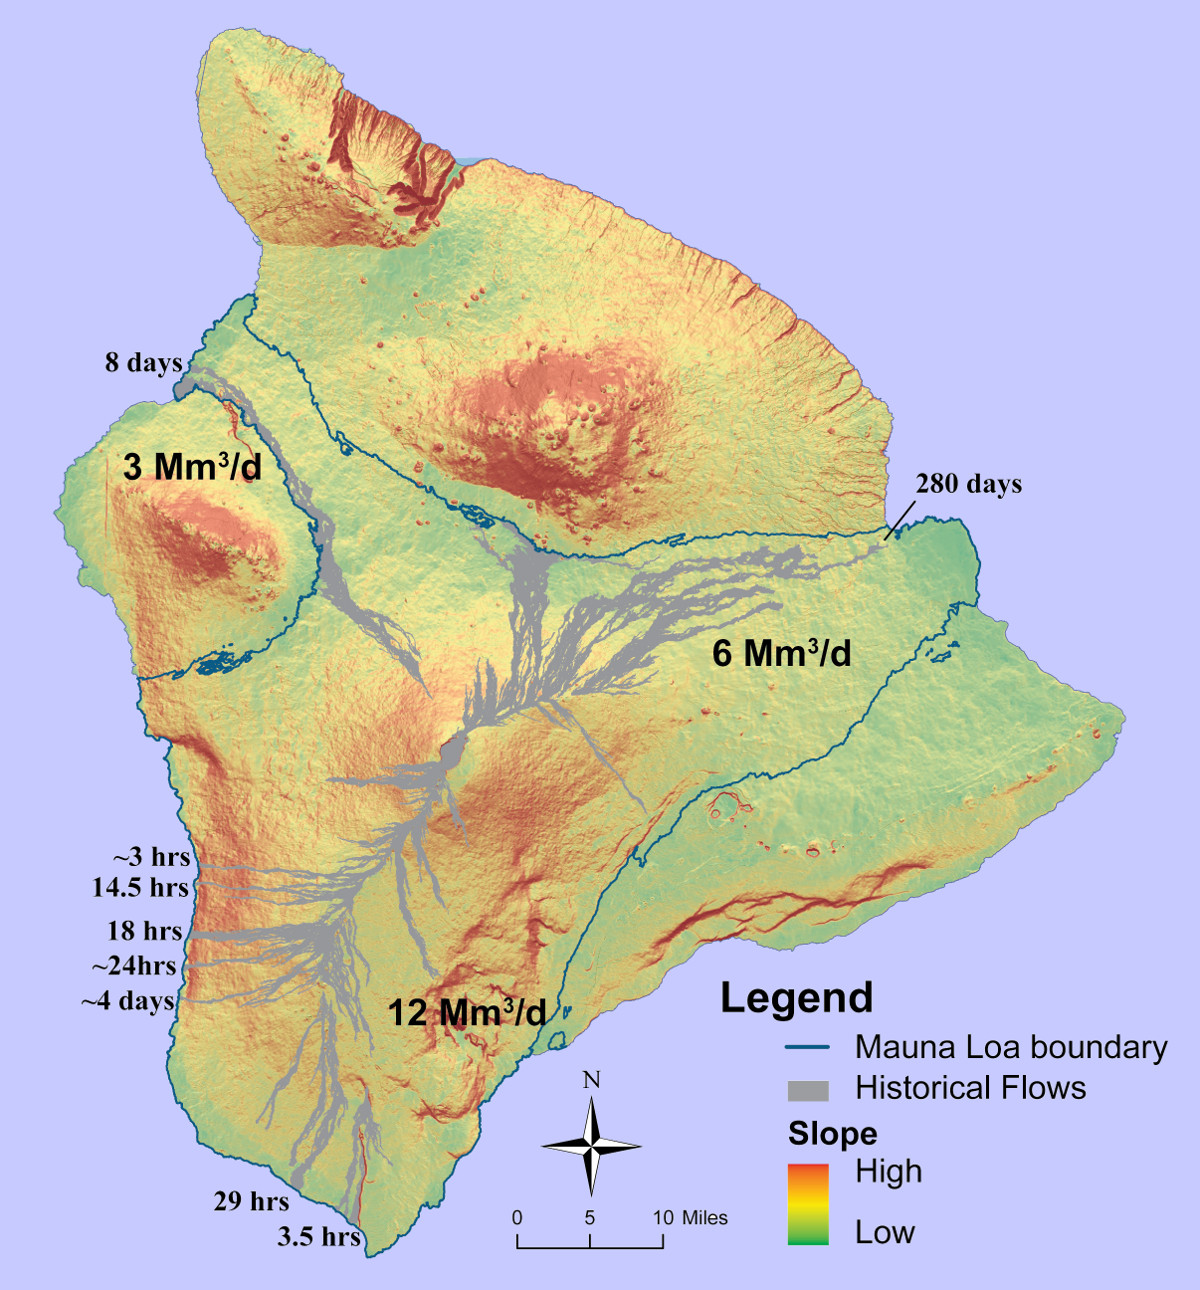
USGS: Slope map of Mauna Loa, including lava flows erupted since 1823 (gray), showing the approximate number of hours or days it took for a flow to advance from the vent location to the ocean or maximum reach of a flow. One flow that moved down the steep slopes on west flank of Mauna Loa reached the ocean in as little as 3 hours after the vent started erupting in 1950. The bold numbers (for example, 12Mm3/d) are the average rates of lava effusion (outpouring of lava) in millions of cubic meters per day. Note the west flank has the steepest slopes (red-orange areas), shortest distance from vent to the ocean, and the highest average rate of effusion during eruptions, resulting in precious little time for warning residents during an eruption from the Southwest Rift Zone of Mauna Loa.
(BIVN) – A few days ago, we reported that scientists were noticing a “slight increase” in deformation and seismicity at Mauna Loa volcano. The USGS Hawaiian Volcano Observatory followed up with this detailed Volcano Watch article on the subject:
“When will Mauna Loa erupt next?” This was the title of a Volcano Awareness Month video presentation released by the USGS Hawaiian Volcano Observatory (HVO) in January 2021. This was also the topic of discussion among HVO scientists last week following the detection of slight changes in ground deformation and seismicity at the summit of Mauna Loa.
Mauna Loa is not currently erupting. But there have been signs of elevated unrest above known background activity since July 2019, when HVO increased its Volcano Alert Level to ADVISORY and its Aviation Color Code to YELLOW.
Mauna Loa is the largest active volcano on Earth, covering just over half of the Island of Hawai‘i. It rises gradually to 4,170 m (13,681 ft) above sea level, and its long submarine flanks descend 5 km (3 mi) below sea level to the ocean floor.
Mauna Loa, like Kīlauea, has a summit caldera and two active rift zones extending from its summit. Eruptions vary from short- to long-lived, and occur at the summit, on either the Southwest or Northeast Rift Zones, or radial vents on the north and western flanks on the volcano.
History has shown that Mauna Loa eruptions can begin with very little warning and produce high volume lava flows that travel long distances in short periods of time, impacting communities on the flanks of the volcano.
Mauna Loa’s last eruption began at its summit on March 25, 1984. A series of fissures subsequently opened along the Northeast Rift Zone, feeding lava flows that came to within 17 km (11 mi) of Hilo Bay in 5 days. The eruption ended on April 15.
The fastest high-volume eruption from Mauna Loa in recorded history began on June 1, 1950, when fissures opened from the uppermost Southwest Rift Zone, generating a lava flow that traveled 24 km (15 mi) and reached the ocean in less than 3 hours! Over the next 23 days, lava flows descended on both sides of the rift zone, inundating the coastal village of Ho‘okena-mauka and covering the Māmalahoa Highway (HWY 11) in three places.
HVO seismometers recorded approximately 271 small (mostly under magnitude 2), shallow (less than 6 km or 4 mi deep) earthquakes last week on Mauna Loa, 226 of which were beneath the summit and upper-elevation flanks. This is a relative increase in activity, but within the range of fluctuations observed over the past several years.
HVO’s modern seismic network is capable of detecting much smaller earthquakes. But even with this greater sensitivity, recent earthquake counts are still lower than observed before past eruptions and have occurred in bursts with periods of quiet in between. We expect that shallow seismic activity will become more sustained—persistent and continuous—before an eruption.
Review of data from 1984 can help put recent observations into perspective. An immediate precursor to the 1984 eruption was an abrupt increase in the number of small earthquakes and volcanic tremor. Hundreds to over a thousand earthquakes were recorded by HVO’s seismic network each day. In the hours before the 1984 eruption, seismic activity increased to the point that the astronomical telescopes on Mauna Kea, 42 km (26 mi) away, could not be stabilized because of the constant ground vibration.
HVO also uses remote monitoring capabilities that were not available in 1984. Telemetered Global Positioning System (GPS) and tiltmeter stations record continuous ground deformation measurements that show slow, long-term summit inflation, consistent with magma supply to the volcano’s shallow storage system. A slight increase in the rate of inflation at the summit that began in January 2021 is continuing.
Current monitoring tools also include high resolution webcams, infrasound arrays, strainmeters, gas emission sensors, and access to spaceborne radar and thermal imaging measurements.
So, when will Mauna Loa erupt next? It is not possible to “predict” the exact date and time. Geophysical measurements indicate that Mauna Loa’s magma storage system has been recharging since the 1984 eruption, and there have been signs of elevated unrest since 2019, but the next Mauna Loa eruption does not appear to be imminent. Nevertheless, the recent slight increase in seismicity and ground deformation is a reminder that Mauna Loa is a “sleeping giant.”
Please watch HVO geologist Frank Trusdell’s virtual presentation for additional information about the past, present and possible future of Mauna Loa.

by Big Island Video News
on at
STORY SUMMARY
HAWAIʻI ISLAND - There has been a relative increase in earthquake activity, recently, as well as a slight increase in the rate of inflation at the volcano summit.